
How to Read a CT Report After a Brain Hemorrhage
A head CT report after intracerebral hemorrhage follows a standard structure. Radiologists begin with the clinical indication, note the scanning technique, list any prior studies used for comparison, detail the findings, and end with a concise impression. Patients and families often feel overwhelmed by the medical terms. Reading the impression first gives the main message before diving into the longer findings section.
The indication section states why the scan was ordered, such as sudden weakness or decreased consciousness. Technique describes a non-contrast CT of the head with images in axial, coronal, and sagittal planes. Comparison mentions whether earlier scans were reviewed. These opening parts set context but rarely contain surprises.
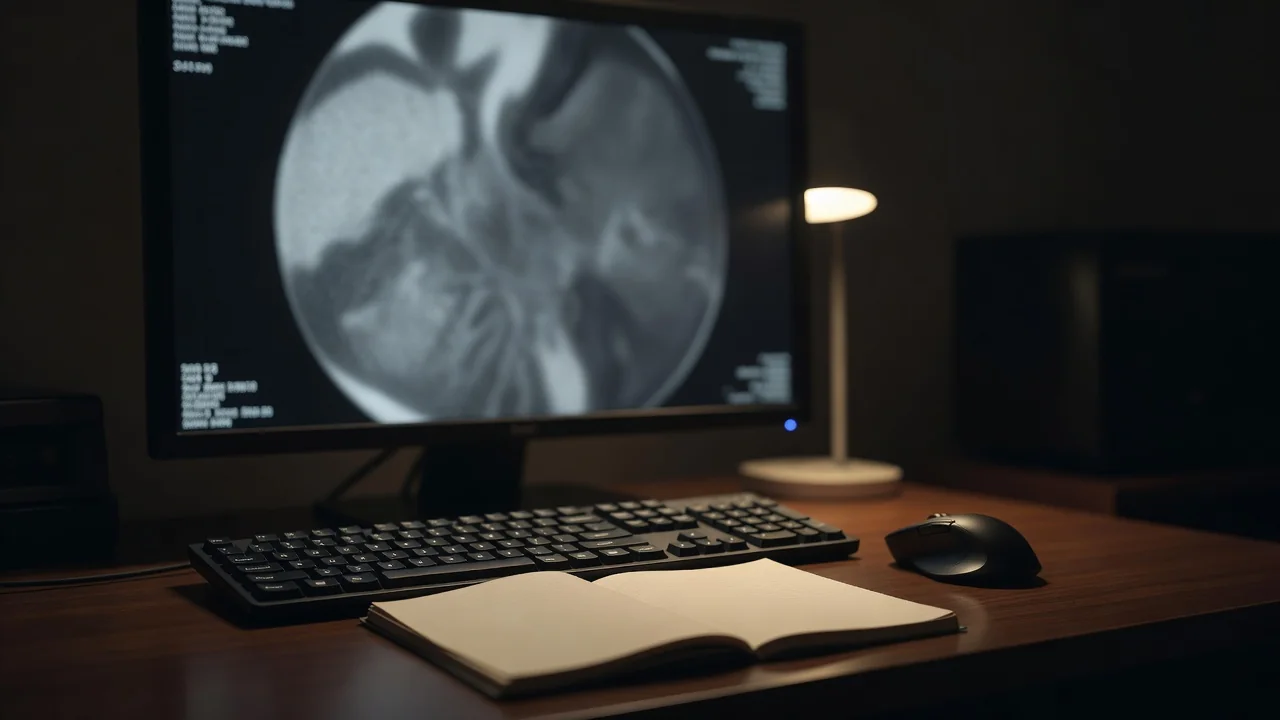
Starting with the Impression
Most clinicians advise reading the impression first. This final paragraph sums up the key observations in a few sentences. It may state the location and size of the bleed, presence of intraventricular blood, or any mass effect. The impression avoids technical jargon when possible and highlights changes that matter for immediate care. After grasping the overview, return to the findings for supporting details.
Common Phrases in the Findings Section
Radiologists use consistent language. An acute hyperdense collection means fresh blood that appears bright white on CT because it measures 40 to 90 Hounsfield units. Midline shift in millimetres describes how far brain structures have moved from their normal central position; a shift greater than 5 mm often signals increased pressure. No hydrocephalus reassures that the ventricles have not enlarged from blocked spinal fluid flow.
Hematoma volume is calculated with the ABC/2 method. The longest diameter (A) and the perpendicular width (B) are measured on the slice with the largest bleed area. The number of slices showing blood multiplied by slice thickness gives height (C). The formula ABC/2 yields volume in millilitres. This number directly feeds into prognostic scores such as ABC2-SPH.
What Hematoma Volume Means for ABC2-SPH
The ABC2-SPH score estimates 30-day mortality after spontaneous intracerebral hemorrhage. It combines five factors: patient age, Glasgow Coma Scale on arrival, hematoma volume in millilitres from the ABC/2 method, presence of intraventricular extension, and whether the bleed is deep or lobar. Each factor adds points. Higher total scores correspond to higher estimated mortality risk. The score guides discussions but does not replace clinical judgment.
Understanding Midline Shift and Mass Effect
Midline shift quantifies how the hemorrhage pushes brain tissue. A 3 mm shift may be mild, while 7 mm or more often indicates the need for closer monitoring. Mass effect refers to compression of nearby structures. Reports may note effacement of sulci or basal cisterns. These terms describe pressure on brain tissue rather than the bleed itself. The treating team integrates these findings with the patient’s neurological exam.
Questions to Ask the Treating Team
- What is the exact hematoma volume in millilitres and how was it measured?
- Does the bleed involve the ventricles, and what does that mean for this case?
- Is there midline shift, and how many millimetres?
- Which factors contribute most to the ABC2-SPH score here?
- Will repeat imaging be needed, and when?
- What additional tests or consultations are planned?
Avoid Self-Diagnosis from Isolated Phrases
Single phrases taken out of context can mislead. A report may mention “hyperdense collection consistent with acute hemorrhage” without explaining stability or clinical meaning. Prognosis depends on many variables beyond one measurement. Families sometimes fixate on a single word like “mass effect” and assume the worst. The full report plus the clinical picture determines next steps. Decisions about care always belong to the treating team.
| ABC2-SPH Component | Typical Contribution |
|---|---|
| Age in years | Higher age adds points |
| Glasgow Coma Scale | Lower score adds points |
| Hematoma volume (ml) | Larger volume adds points |
| Intraventricular blood | Present adds points |
| Location (deep vs lobar) | Deep location adds points |
Reading a CT report becomes easier with practice. Focus first on the impression, then examine the measurements and descriptions in findings. Translate numbers such as volume in millilitres or shift in millimetres into the ABC2-SPH framework to understand estimated risks. Prepare a short list of questions for the medical team. Remember that one report is only a snapshot. Trends over time and the patient’s overall condition guide treatment choices. The team integrates imaging with laboratory results and repeated examinations to form a complete picture.
Students reviewing sample reports should note how radiologists avoid speculation. They describe what they see: density, location, volume, extension, and secondary effects. Clinical correlation is left to the physicians caring for the patient. This separation keeps the radiology report objective and reproducible. Over months, learners recognize patterns such as typical basal ganglia bleeds versus lobar hemorrhages and learn which details most affect the ABC2-SPH calculation.